Journal of Biomedical Engineering and Biosciences (JBEB)
ISSN: 2564-4998

Volume 10 - Year 2023 - Pages 41-52
DOI: 10.11159/jbeb.2023.007
Reliable Multimodal Heartbeat Classification using Deep Neural Networks
Ioana Cretu1, Alexander Tindale2, Maysam Abbod1, Ashraf Khir3, Wamadeva Balachandran1, Hongying Meng1
1University London, London, UK
ioana.cretu@brunel.ac.uk; hongying.meng@brunel.ac.uk; maysam.abbod@brunel.ac.uk, wamadeva.balachandran@brunel.ac.uk
2Royal Brompton and Harefield Hospitals, NHS Foundation Trust, London, UK
a.tindale@rbht.nhs.uk
3Durham University, Durham, UK
ashraf.w.khir@durham.ac.uk
Abstract - Arrhythmias are deviations from the normal heart rhythm with impact on the cardiovascular health. Their prompt detection plays an important role in mitigating potential negative outcomes, particularly in patients in the intensive care units (ICU). Heartbeat detection has mainly been focused on electrocardiogram (ECG) signals. However, ICU patient mobility frequently leads to disconnection of certain ECG leads, potentially compromising the accurate heartbeat classification. Arterial line blood pressure (ABP) and central venous pressure (CVP) signals are routinely monitored in ICU patients. Changes in the ABP and CVP suggest alterations in the haemodynamic status and cardiac function of the patients. Thus, leveraging these signals for heartbeat classification, either independently or in conjunction with ECG data, present a viable approach to ensure that even in scenarios where ECG signals are unavailable, alarm systems alerting healthcare providers of arrhythmias remain functional. Moreover, while many researchers have successfully created methodologies to accurately classify heartbeats including paced beats, none were able to distinguish various sub-classes of paced heartbeats. A more comprehensive distinction is crucial as it not only aids in the identification of pacing settings but also facilitates the detection of inadequate pacing settings, a critical aspect in patient care. In this paper, we employ a hybrid model using long-short term memory networks (LSTM) and convolutional neural network (CNN), along with different residual CNN (ResNet) models for multimodal arrhythmia classification and for comprehensive paced heartbeats classification. When using all three channels, ResNet50 achieved the best accuracy of 99.58% on 5 different arrhythmia classes, whereas ResNet34 achieved an accuracy of 93.82% on 12 paced classes. The significant efficiency of utilizing ABP and CVP signals independently for classification, was also highlighted. ResNet50 was trained with ABP and CVP signals independently and correctly identified arrhythmias with an accuracy of 98.79% and 96.67%, respectively. For classifying 12 different paced heartbeats, ResNet34 achieved 74.04% accuracy with ABP signals and 74.38% with CVP signals. Moreover, the same ResNet50 model was trained on the MIT-BIH arrhythmia database, achieving an accuracy, sensitivity, and precision of 98.78%, 98.77% and 98.80%, which demonstrates the scalability of the proposed model.
Keywords: Arrhythmia, Heartbeat classification, Multimodal, Blood pressure, Paced.
© Copyright 2023 Authors This is an Open Access article published under the Creative Commons Attribution License terms. Unrestricted use, distribution, and reproduction in any medium are permitted, provided the original work is properly cited.
Date Received: 2023-08-20
Date Revised: 2023-09-25
Date Accepted: 2023-09-30
Date Published: 2023-10-23
1. Introduction
Cardiovascular diseases (CVDs) are the leading cause of death, accounting for up to 30% of the annual deaths each year, according to the data from the World Health Organisation (WHO). Therefore, it is of utmost importance to identify CVDs at the earliest stage in order to initiate prompt medical interventions [1]. Arrhythmias, which are deviations from the normal heart rhythm, are common CVDs indicators that are usually divided into two groups: life-threatening and non-life-threatening. Examples of life-threatening arrhythmias include asystole and ventricular fibrillation, whereas non-life-threatening arrhythmias include atrial fibrillation (AF), left bundle branch block (LBBB) and premature ventricular contractions (PVC). Arrhythmias are frequently detected using electrocardiogram (ECG) records which are non-invasive tests that record the electrical activity of the heart by placing electrodes on the skin of the patients. Distinctive features and morphologies exhibited by ECG signal waveforms are intricately linked to specific arrhythmias, serving as valuable guidelines for clinicians in the identification, treatment, and ongoing monitoring of these cardiac rhythm abnormalities.
ECG recordings have been extensively used to develop computer-aided diagnosis (CAD) systems through the use of signal processing and machine learning classification models such as Support Vector Machines (SVMs) or deep learning models such as Convolutional Neural Networks (CNNs). As a result, over the past four decades, the goals of hospital ECG monitoring have evolved from basic heart rate tracking to the diagnosis of complex arrhythmias. However, despite the progress made in technology, the essential role of human supervision in analysing ECG monitoring data remains crucial, particularly in the intensive care units (ICU), where the patients often have complex conditions and are given medication which can facilitate the development or exacerbation of arrhythmias [2]. In addition, most of the patients in the ICU are subjected to cardiac resynchronization therapy (CRT), which usually involves the implantation of a pacemaker device that helps in coordinating the heart's conduction. The correct identification of paced beats, including the type of pacing and the settings applied to the pacemaker, serve as important markers that can help clinicians diagnose pacing failures earlier and more efficiently. For instance, the atrioventricular (AV) time delay setting, representing the time between pacing the atria and pacing the ventricles, is an important pacing parameter that is crucial for maximizing CRT efficacy. Moreover, in the context of ICU units, patient mobility frequently leads to disconnection of certain ECG leads, potentially compromising the CAD systems to accurately perform arrhythmia detection [3], and detect the critical changes that occur with CRT.
Arterial line blood pressure (ABP) and central venous pressure (CVP) signals are routinely monitored for ICU patients. The ABP signals are collected using a catheter, usually inserted in the radial artery of the wrist, which consists of systolic upstroke, dicrotic notch and diastolic downslope. The CVP signals are measured with a central venous catheter placed in the superior vena cava and typically consist of phases such as: a wave, c wave, x descent and v wave. Although these signals do not directly indicate the activity of the heart, changes in the ABP and CVP indirectly suggest alterations in the haemodynamic status and cardiac function of the patients [4]. For instance, AF causes irregular pulse waves in the ABP signals [5] and is associated with the absence of the a wave or the fusion of the a and c waves on the CVP signal [6]. Thus, leveraging these signals for heartbeat classification, either independently or in conjunction with ECG data, presents a viable approach to ensure that even in scenarios where ECG signals are unavailable, alarm systems alerting healthcare providers of arrhythmias remain functional. Moreover, while many researchers have successfully created methods for accurate heartbeat classification including paced beats, none were able to distinguish various sub-classes of paced heartbeats. A more comprehensive distinction is crucial as it not only aids in the identification of pacing settings but also facilitates the detection of inadequate pacing settings, a critical aspect in patient care. This ensures timely intervention and appropriate treatment for ICU patients.
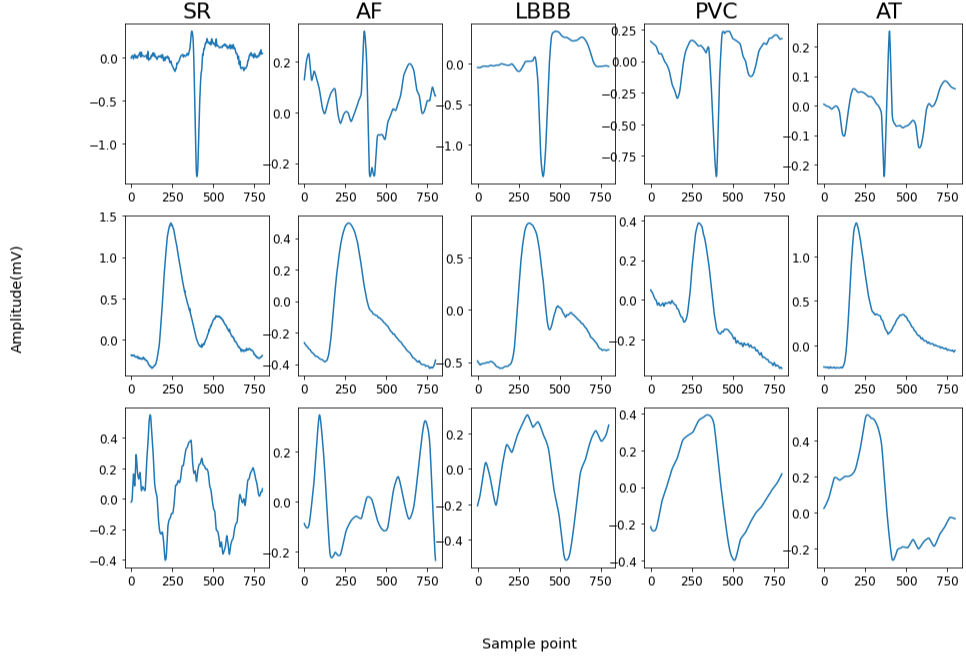
In this work, we developed deep learning models that are able to accurately categorize 5 classes (e.g. sinus rhythm (SR), atrial fibrillation (AF), atrial tachycardia (AT), left bundle branch block (LBBB), and premature ventricular contractions (PVC)) of arrhythmia heartbeats (Figure 1) and 12 classes (atrial paced and ventricular paced (APVP) for atrioventricular (AV) delay of 40, 80, 120, 160, 180, 200, 240, 280, and atrial paced ventricular sensed (APVS) for atrioventricular delays of 200, 220, 240, 280, 320) of paced heartbeats utilizing single-channel ECG data in combination with ABP and CVP signals, as a continuation of our previous work that can be found in [7]. Additionally, the study highlighted the significant efficacy of utilizing ABP and CVP signals independently for heartbeat classification. The development of precise prediction models for arrhythmias that incorporate both ECG and haemodynamic waveforms presents promising prospects for advancing computer-aided diagnosis (CAD) systems, especially within the dynamic and vulnerable environment of the ICU, where patients' conditions are frequently unstable and dangerous rhythm changes can manifest at any stage.
The subsequent sections of this paper are organized as follows. Section 2 provides an overview of the relevant literature in the field. Section 3 describes the dataset used in this paper, the workflow of the methodology and the proposed models. Section 4 presents the results and discussion of the classification, including results obtained on the MIT-BIH arrhythmia database [8] and a comparison of our method with the literature, and finally, Section 6 will conclude this work.
2. Related Work
Recently, machine learning and deep learning techniques have shown great success in detecting arrhythmias from ECG signals. Unlike deep learning models, machine learning models require additional steps of feature extraction and feature selection prior to the classification stage. This involves the extraction of features such as QRS complex characteristics, RR interval-based features, frequency-domain features or heart-rate features. Other techniques use wavelet transforms (WT) such as continuous wavelet transform (CWT) [9] and discrete wavelet transform (DWT) [10], [11] as features to the classification model. Although these models achieve good results, the process of feature extraction can either require expert knowledge or be tedious and time consuming. This aspect has motivated researchers to explore the development of deep learning techniques for this particular application.
Deep learning models such as CNNs [12]–[15], recursive neural networks (RNNs) [16], long short-term memory networks (LSTMs) [17], autoencoders [18], and hybrid models combining CNN and LSTM architectures [19]–[21] have been frequently used in the literature for arrhythmia classification. CNNs have emerged as promising networks for ECG arrhythmia classification, primarily due to their ability to handle multi-dimensional signals and images effectively. In previous studies, CNNs were successfully utilized for this task by transforming ECG signals into two-dimensional (2D) images [22], spectrograms [23], or 2D time-frequency representations. However, recent advancements have enabled CNNs to process 1D signals directly, eliminating the need for intermediate transformations and achieving impressive accuracy in arrhythmia classification.
In [12], the authors proposed a 9-layer 1D CNN model to classify 1 lead ECG heartbeats for 5 different classes from MIT-BIH arrhythmia database. They calculated the standard deviation and mean of Z-score from the ECG signals to generate synthetic data and balance the arrhythmia classes, achieving an overall accuracy of 94.47%. In [20], a hybrid model combining CNNs and LSTMs layers was developed using ECG heartbeats from MIT-BIH arrhythmia database, achieving a 98.10% overall accuracy for 5 classes. In a related study conducted by authors [14], they achieved a notable ECG arrhythmia classification accuracy of 98.30% by developing a 4-layer CNN classifier. The CNN architecture incorporated max pooling layer in between the convolutions, and three fully connected layers at the end of the network. To address the issue of imbalanced class distribution in the MIT-BIT dataset, the authors employed the synthetic minority oversampling technique (SMOTE) to balance the training data. Houssein et al. [24] performed feature extraction prior to the CNN classification and obtained class balance by using SMOTE and random undersampling. The authors achieved high-performance results by utilizing a set of six distinct types of features extracted from each heartbeat, which were subsequently fed into the 1D CNN classifier. In [25], the authors used a deep CNN architecture with a total of 34 layers to identify arrhythmias by utilising single-lead ECG signals from ambulatory ECG monitoring devices. The diagnostic accuracy of the deep-CNN model exceeded the average performance of a cardiologist, this being attributed to the ability of the CNN to learn subtle patterns in the data. Although the stated works proved to be incredibly effective for ECG arrhythmia classification models, deep CNN architectures are usually confronting with the vanishing gradient problem, which occurs when the gradients that are used to update the weights of the network become very small and diminishes the ability of the network to learn meaningful representations of the data. To solve this issue, researchers proposed Residual Neural Networks (ResNet) architectures [26] which use skip connections, also known as residual connections, that allow the networks to skip certain layers and propagate the information from the deeper layers in the network with the current one. In this manner, the network is able to preserve important features while preventing their degradation as they pass through multiple layers. ResNet models have been successfully applied in ECG arrhythmia classification. Zhang et al. [27] proposed a ResNet with 101 layers (ResNet101) architecture for single-lead ECG which achieved a 99.75% accuracy using the MIT-BIH database. The authors transformed the segmented ECG heartbeats into 2D time-frequency diagrams using the Hilbert transform (HT) and the Wigner-Ville distribution (WVD). In another work, Rahman et al. [28] used a pre-trained ResNet50 (transfer learning) model to classify ECG heartbeats in the form of images, achieving an overall 91% accuracy. More recently, 1D ECG signals have been accurately classified in ResNet models, eliminating the need for prior 2D transformations [29], [30]. In their work, Khan et al. [29] implemented a 1D ResNet with six convolutional layers and three max pooling layers to classify arrhythmia single-lead ECG heartbeats. In addition, they used SMOTE to balance the minority classes which helped them achieve 98.63% accuracy, 92.41% sensitivity, and 99.06% specificity.
Although all the aforementioned methods achieved great accuracy on ECG arrhythmia classification signals, little has been done on the multimodal physiological signals. Blood pressure signals such as ABP and photoplethysmogram (PPG) have been first used for arrhythmia classification by Kalidas et al. [31] in the Physionet/Computing in Cardiology 2015 Challenge with the goal of suppressing false alarm generation in ICU. In their work, they applied spectra and time-domain feature extraction on the ECG, ABP and PPG signals, which then were fed into an SVM for the final classification, achieving a sensitivity of 94% and specificity of 86%. In [32], Arvanaghi et al. used frequency, power, and entropy features extracted from ECG and ABP signals in a Least Square SVM (LS-SVM) classifier. The method achieved an accuracy, sensitivity, and specificity rates of 95.75%, 96.77%, and 96.32%. In a different study, Arvanaghi et al. demonstrated the contribution of the ABP signals in arrhythmia classification by utilising them alone in a CNN classifier under the form of scalograms, reaching 90.16% F1-score, 89.03% accuracy, and 81.46% sensitivity. In [33] the advantage of incorporating the ABP was again highlighted. Two class arrhythmia classification was performed on ECG features only, and on ABP and ECG features together. The accuracy of the model achieved 89% only with ECG features versus 96.6% when using both ABP and ECG.
Numerous studies have been conducted on automatic ECG heartbeat classification models, leading to impressive accuracies as high as 99.75%. However, these studies have predominantly focused on ECG signals, neglecting the potential utilisation of other physiological signals, such as ABP, PPG, and CVP signals, which are easily accessible in ICU patients. Moreover, while many of these studies have successfully identified paced beats, none were able to distinguish various sub-classes of paced heartbeats. There are a few ways of splitting the heartbeats in the context of heartbeat classification. Researchers either follow the Association for Advancement of Medical Instrumentation (AAMI) standards, which do not directly include paced beats and split the data into non-ectopic (N), supraventricular ectopic (S), ventricular ectopic (V), fusion (F), and unknown (Q) beats, or follow the guidelines given by clinicians and split the datasets into normal (N), left bundle branch block (LBBB), right bundle branch block (RBBB), premature ventricular contraction (PVC), and paced beat (P). Either way, the paced beats are not distinguished by the settings given by the pacing device, and a more comprehensive distinction is crucial as it not only aids in the identification of pacing settings but also facilitates the detection of inadequate pacing settings, a critical aspect in patient care. Furthermore, the integration of multi-modal signals holds the potential to improve the detection accuracy, particularly in ICU settings where patients may inadvertently displace ECG leads due to their unconscious state or movement.
3. Materials and Methods
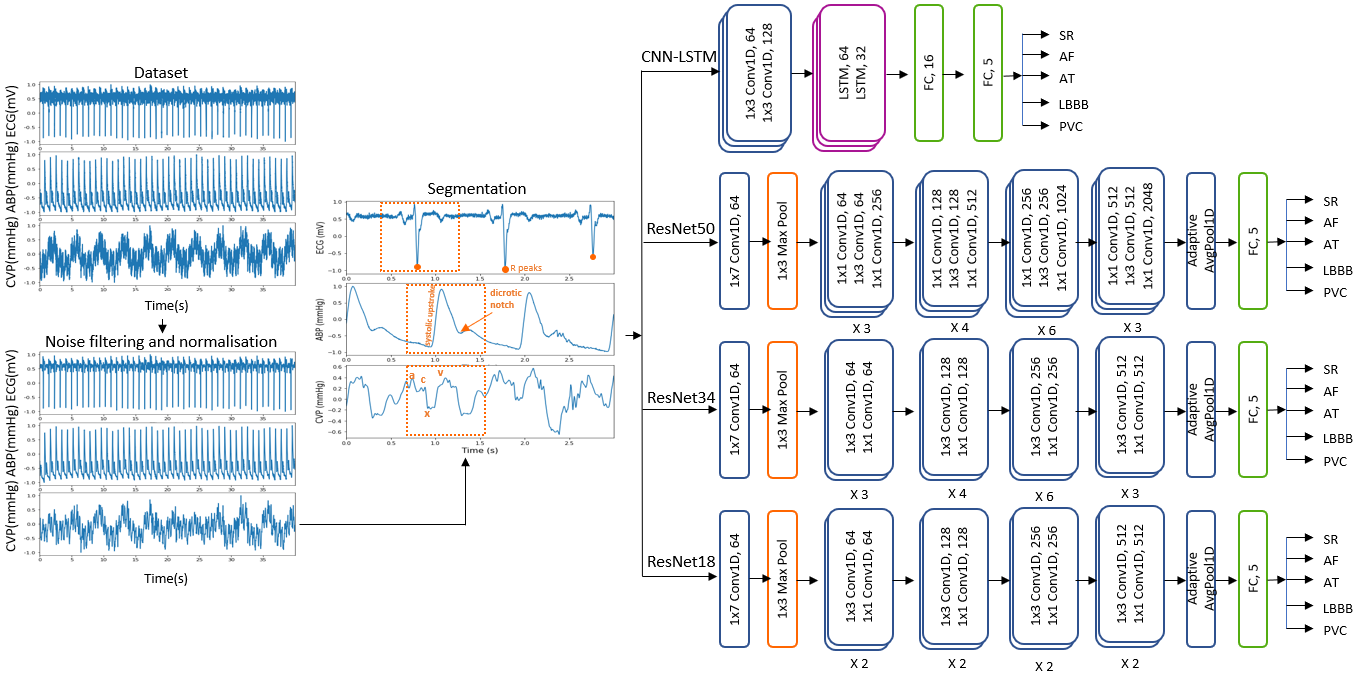
The overview of the proposed method can be seen in Figure 1. Pre-processing involving noise filtering, normalisation and segmentation of the signals in individual heartbeats are first performed. The classification is first performed on the entire set of signals (ECG+ABP+CVP) using different deep learning architectures such as CNN-LSTM, ResNet18, ResNet34, and ResNet50. The model providing the most accurate results is then used to assess the potential of each signal as follows: ECG, ABP and CVP are individually used for classification, then we use the blood pressure signals (ABP and CVP) together. In the end, we assess the scalability and generalizability of the proposed methodology by choosing the model with the best performance and using it on the MIT-BIH arrhythmia database.
3. 1. Dataset
The dataset used in this study consisted of simultaneous lead v1 ECG, ABP and CVP signals collected at a sampling frequency of 1000 Hz in Harefield Hospital London from patients in the ICU following cardiac surgery. The arrythmia dataset consists of 29 patients, with five different arrhythmias: sinus rhythm (SR), atrial fibrillation (AF), atrial tachycardia (AT), left bundle branch block (LBBB), and premature ventricular contractions (PVC). The paced dataset consists of 25 patients with 12 classes: atrial and ventricular paced (APVP) for AV delay setting of 40, 80, 120, 160, 180, 200, 220, 240, 280, and atrial paced ventricular sensed (APVS) for AV delays of 200, 240, 280, 320. This study was approved by the South West - Cornwall and Plymouth Research Ethics Committee as part of the PACESIM trial (ISRCTN15383573). All patients gave written informed consent.
In order to evaluate our model against the literature we used lead 2 from the MIT-BIH arrhythmia dataset, an open-sourced database provided by the Massachusetts Institute of Technology that contains a collection of long-term ECG recordings for arrhythmia analysis that were recorded with a sampling frequency of 360 Hz. The heartbeats extracted from MIT-BIH database where grouped according to the AAMI standard.
3. 2. Data Pre-processing
Signals recorded in ICU patients are often highly affected by noises caused by electronic devices, motion or electrode artefacts. The CVP, for instance, is highly affected by respiration, with values increasing during inspiration and decreasing during expiration, whereas ECG signals present multiple motion and electrode artefacts. To remove these noises, we applied DWT on all three signals, each being decomposed with a different wavelet: biorthogonal for the ECG and CVP signals, and Daubechies for ABP signals. Then we normalised all three signals in the [-1;1] range and performed ECG R peak detection using Pan-Tompkins algorithm.
The heartbeat segmentation of the signals has been approached differently for ECG and blood pressure signals, respectively. As it can be seen in Figure 2, the delay between the ventricular contraction of the heart and the response seen in the haemodynamic waveforms causes a delay between the R peaks seen in the ECG signals and the systolic upstroke and a wave in the ABP and CVP, respectively. This phenomenon needs to be reflected in the segmentation strategy. Therefore, the ECG heartbeat segmentation was performed using 800 milliseconds (ms) around the R peak, whereas the CVP and ABP are segmented using 200ms before the location of the R peaks and 600ms after the R peaks location. In this manner we are able to align each heartbeat with the correct corresponding ABP and CVP response.
3. 3. Classification
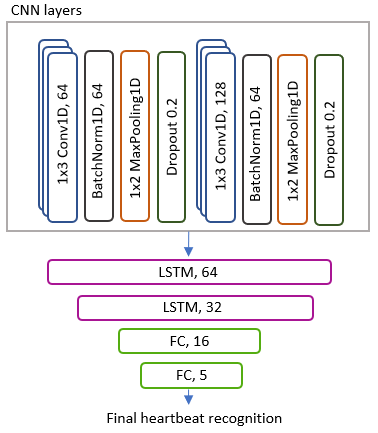
The classification was performed using two types of architectures: a hybrid model using CNN and LSTM layers and ResNet models. LSTM and CNN models are well known for their ability of accurately classifying arrhythmias. However, when combining both CNN and LSTM layers, the models are capable of capturing not only local spatial features, but also long-term temporal dependencies. In this work, the proposed CNN-LSTM model is shown in Figure 3. This has two 1D convolutional layers, each followed by 1D batch normalisation layers, ReLu activation function, max pooling and dropout layers. The convolutional layers are then followed by two LSTM layers, and 2 fully connected layers at the end. The ResNet architectures, on the other hand, follow the same architectures adopted in the well-known ResNet18, ResNet34 and ResNet50 models, with the exception that in our work we will use 1D layers able to use one or multiple channels at once, as opposed to 2D layers which need prior transformations and fusion of the channels. As explained in Section 2, ResNets have shown increased performance compared to traditional CNN layers due to their ability of propagating the information from deeper layers in an efficient and stable manner, which led us to explore their potential on multimodal channel arrhythmia classification.
3. 4. Evaluation Metrics
The performance of multi-class classification models is assessed using well-known metrics such as accuracy (Acc), sensitivity (Sen), precision (Pre) and F1-score. The Acc represents the overall performance of the model’s predictions and, as shown in Eq. (1), is calculated as the ratio between the sum of the true positives (TP) and true negatives (TN) and the number of total predictions, which is the sum of correct predictions, the false positives (FP) and false negatives (FN). The Sen assesses the ability of a model to correctly identify TP instances and is calculated using Eq. (2). Pre represents the ability of the model to identify positive instances out of all the instances predicted as positive, as seen in Eq. (3). The F1-score, combines Pre and Sen, as shown in Eq. (4).


4. Results and Discussion
The classification performance was analysed for four categories: overall performance of the models on the arrhythmia dataset, the performance of the best model on the arrythmia dataset when using one-channel and hemodynamical signals only, overall performance of the models on the paced dataset and the performance of the best model on the paced dataset when using different signals and combinations of signals. The data is first split into training set, consisting of 70% of the data, validation set and testing set, both consisting of 15% of the data. We also employed a stratified split to maintain the class distribution, ensuring that each class is adequately represented in both the training, validation, and testing datasets. When analysing the performance of individual signals, we split the data and train the models using ECG, ABP and CVP signals individually.
4. 1. Multi-channel Arrhythmia Classification
The overall arrhythmia classification results obtained on our arrhythmia dataset containing all three sets of signals can be seen in Table 1. First, hyperparameter optimisation was performed on the models using the Weights and Biases module, a machine learning experimentation platform in Python. We tested Adam, AdamW, Root Mean Square Propagation (RMSprop), AdamW and Stochastic Gradient Descent (SGD) optimizers, with learning rates ranging from 0.0001 to 0.1, and three different batch sizes of 8, 16 and 32. Random hyperparameter method was used in the experiments; this generates random combinations of hyperparameters values from the predefined search space. The obtained results suggested as common hyperparameters for all the models a learning rate of 0.0003, a batch size of 16 and Adam optimiser with the default beta values. We used the same hyperparameters across all the tested models, which were developed using PyTorch 3.7.
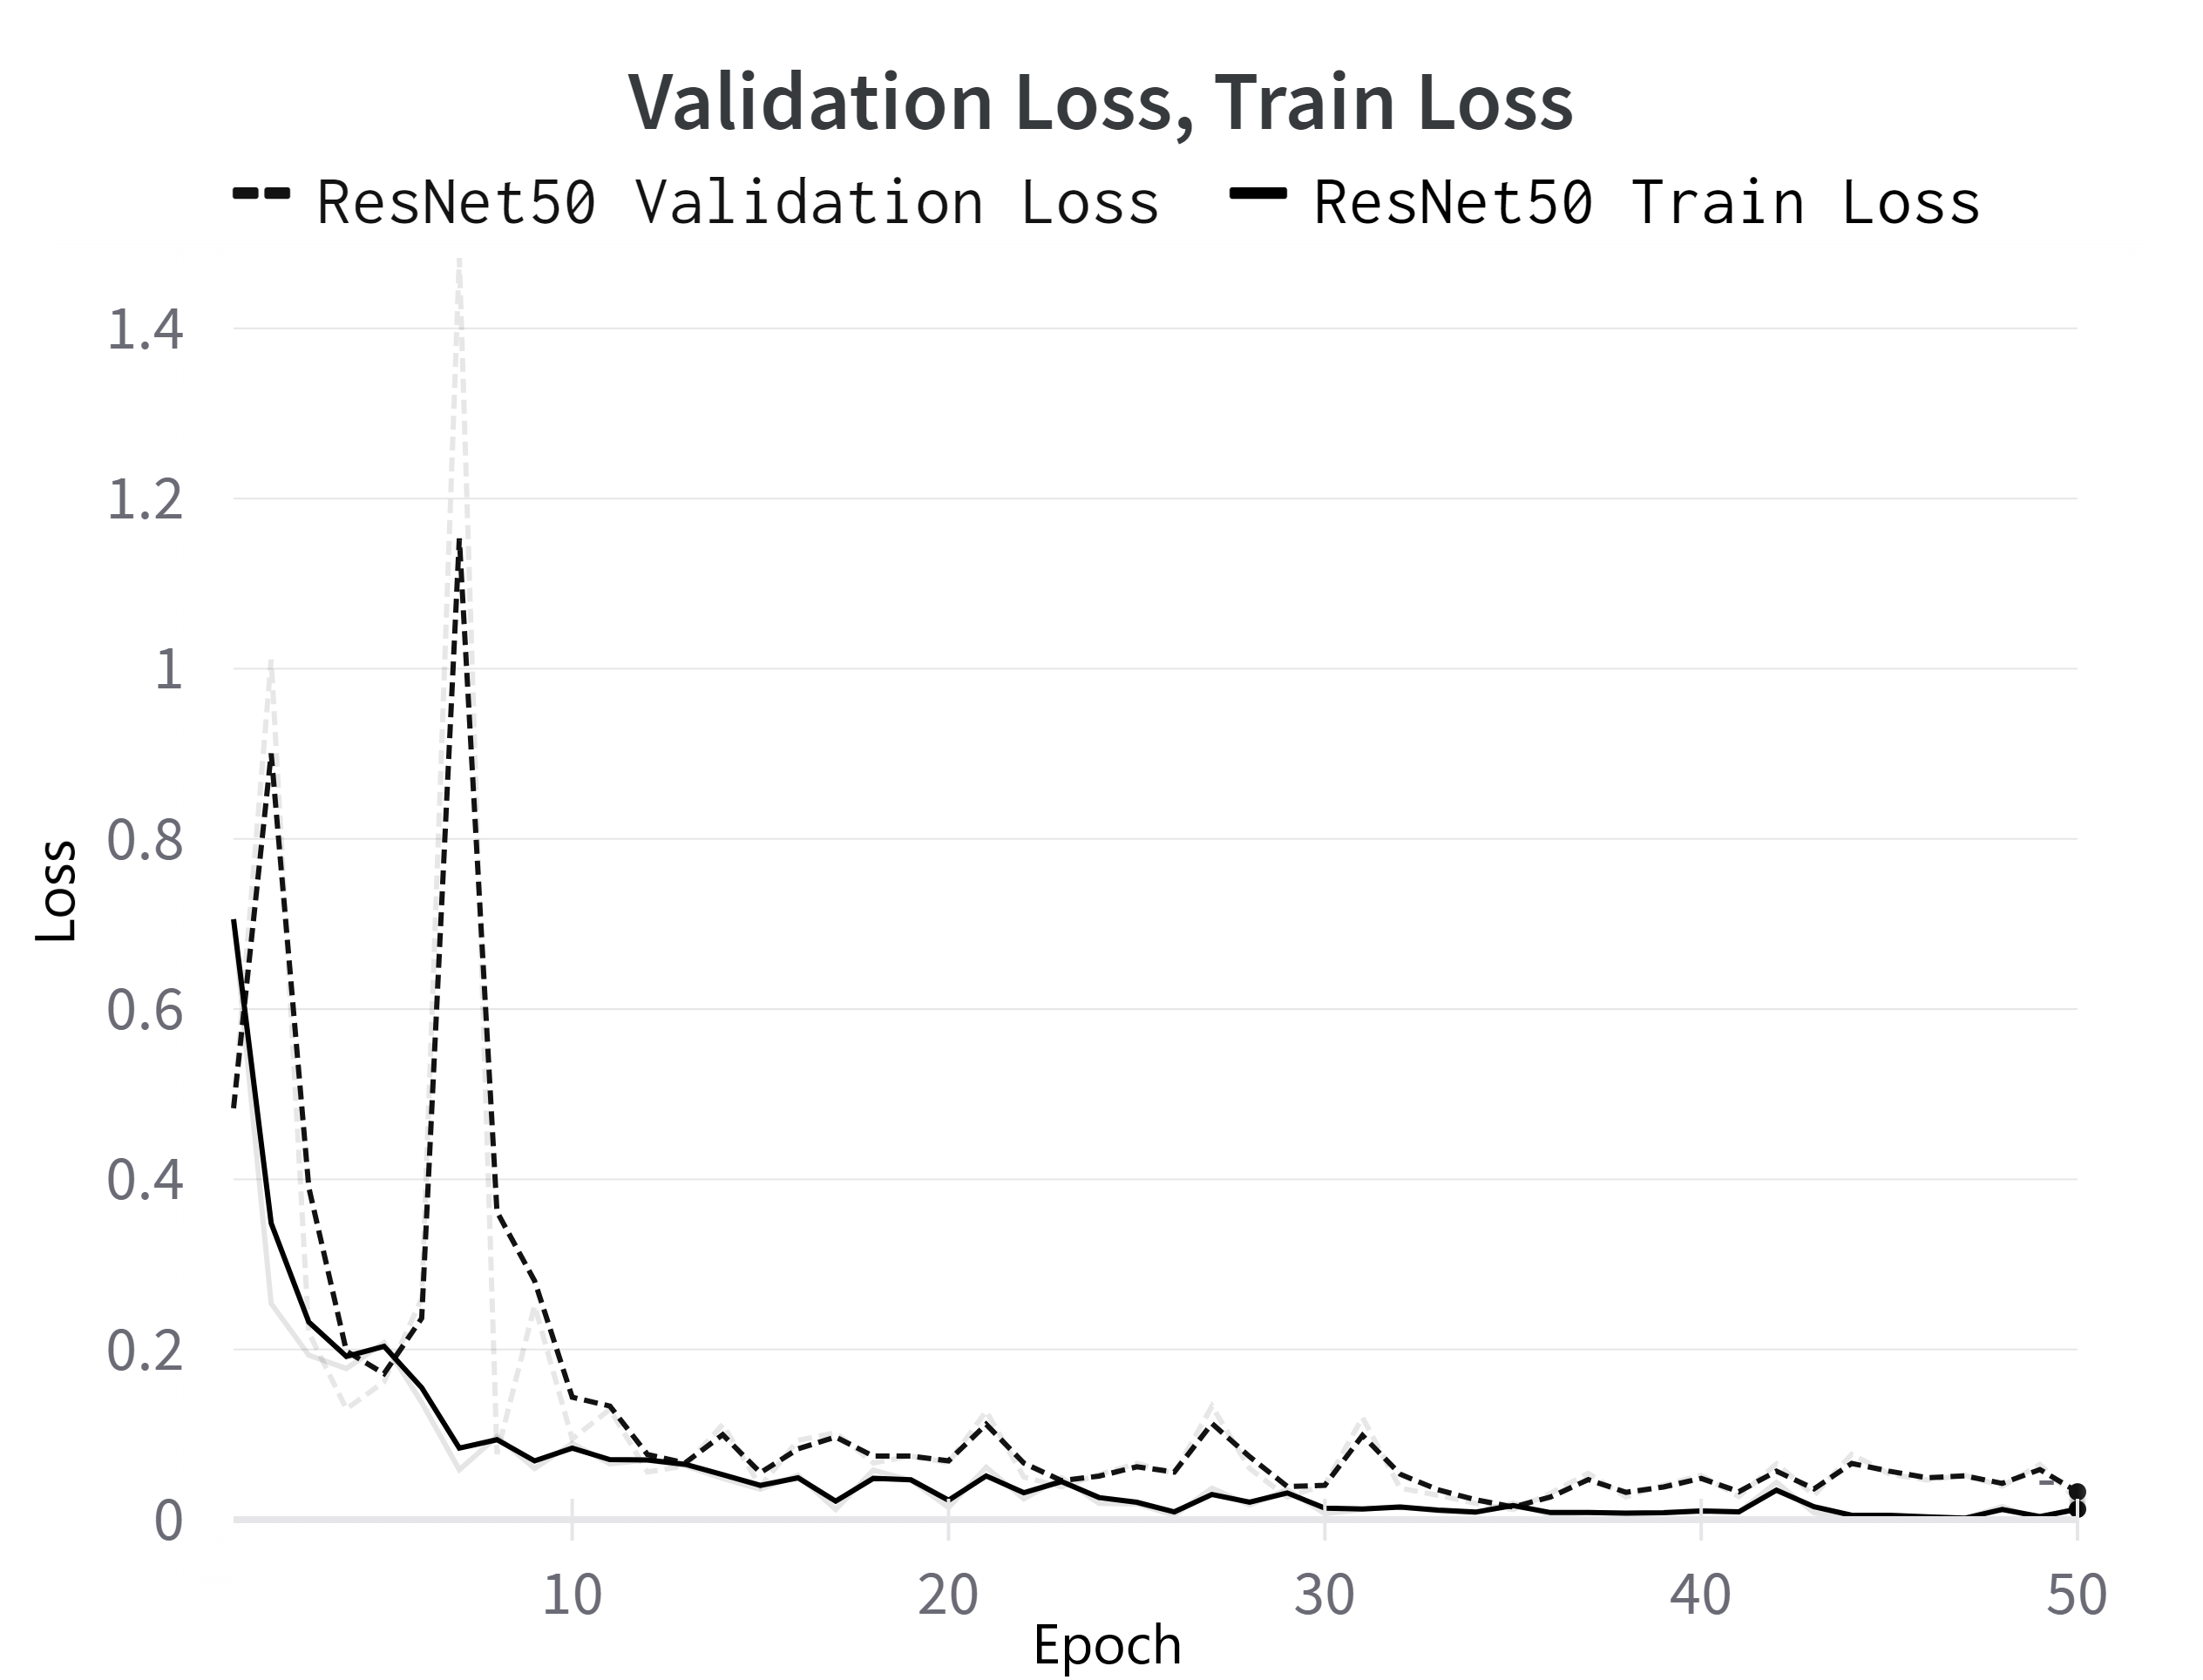
The best results are achieved when using the ResNet50 model, with an Acc that reaches up to 99.58%, a Sen of 99.59%, Pre of 99.58% and an F1 score of 99.57%, all of which are comprehensively presented in Table 1. The progression of the loss in the ReNet50 model during both training and validation phases can be seen in Figure 4. Notably, all of the models achieved good accuracies over 98%, with smallest results obtained using the CNN-LSTM network, which is also the network with the simplest architecture. The second-best classifiers are ResNet18 and ResNet34, with results very similar to one another. This demonstrates that deeper CNNs architectures that use residual connections, such as the ResNet architectures that we tested, are able preserve the information flowing through the network and can bridge the gap between a good classifier and one that reaches a performance near perfection.
Table 1. Overall performance of the arrhythmia classification models when using all three signals: ECG, ABP and CVP
|
Overall results (%) |
CNN-LSTM |
ResNet18 |
ResNet34 |
ResNet50 |
|
Acc |
98.59 |
99.38 |
99.38 |
99.58 |
|
Pre |
98.65 |
99.40 |
99.41 |
99.59 |
|
Sen |
98.59 |
99.37 |
99.38 |
99.58 |
|
F1 score |
98.55 |
99.37 |
99.37 |
99.57 |
4.2. Arrhythmia Classification Across Varied Channels
ResNet50 classifier was then used to assess the classification performance of each individual channel and combinations of channels due to its outstanding performance shown on multi-channel classification. This is done to test the ability of individual signals of being used alone in the classification of arrhythmias, especially in ICU where patients are prone to sudden changes in their cardiac state and ECG electrodes might not always be properly positioned and recorded. Table 2 illustrates the performance metrics obtained on the test set when using the ResNet50 classifier on different signals and combinations of signals. As expected, among all three individual signals, ECG alone performs better than ABP and CVP, respectively. Specifically, when using only the ECG signal, an accuracy of 99.38% is achieved. In contrast, using the ABP signal yields an accuracy of 98.79%, while using the CVP signal results in an accuracy of 96.67%. When we use the ECG channel along with blood pressure channels, the accuracy of heartbeat classification significantly increases. Specifically, when combining ECG with ABP, we achieve a remarkable Pre of 99.95%. Likewise, when combining ECG with CVP, we attain a high Pre of 99.68%. Nevertheless, the classification results achieved on the individual blood pressure signals demonstrate the ability of ABP and CVP signals to capture changes in the conduction of the heart, even in the absence of ECG leads.
Table 2. The testing performance metrics of ResNet50 classifier on different one-channel and combination of channels as opposed to the multi-channel performance.
|
Signal |
Acc (%) |
Sen (%) |
Pre (%) |
|
ECG+ABP+CVP |
99.58 |
99.58 |
99.60 |
|
ECG |
99.38 |
99.38 |
99.41 |
|
ABP |
98.79 |
98.70 |
98.78 |
|
CVP |
96.67 |
96.68 |
96.73 |
|
ABP+CVP |
98.19 |
98.19 |
98.29 |
|
ECG+ABP |
99.80 |
99.68 |
99.95 |
|
ECG+CVP |
99.80 |
99.95 |
99.68 |
4.3. Multi-channel Paced Heartbeats Classification
Similar to the previous sections, we first performed hyperparameter optimisation on the models using the Weights and Biases module. For the CNN-LSTM and ResNet18 models, we found that RMSprop is the most effective optimizer, using a learning rate of 0.001. However, for ResNet34, RMSprop with a learning rate of 0.0001 works best, while for the ResNet50 model, SGD with a learning rate of 0.01 proved to be the optimal choice. Additionally, we used a batch size of 8 for both the CNN-LSTM and ResNet34 models, while a batch size of 32 was optimal for ResNet18. In contrast, ResNet50 achieved the highest performance when using the SGD optimizer, a learning rate of 0.01, and a batch size of 16.
The overall results obtained on our paced dataset containing all three sets of signals can be seen in Table 3. The ResNet34 model outperforms the others, achieving an Acc of 93.82%, a Sen of 93.33%, Pre of 94.54%, and an F1 score of 93.78%. Nonetheless, we can see that all ResNet classifiers yielded similar results, with Acc between 93% and 94%, while the CNN-LSTM classifier lags behind with an Acc of 80%. A detailed breakdown of Pre, Sen, and F1 score for each class obtained using the ReNet34 model can be seen in Table 4. The results show that 8 out of 12 classes achieved a Pre over 90% with some classes reaching 100% Pre, whereas just 4 classes yield a Pre between 82% and 90%.
Table 3. Overall performance of the paced classification models when using all three signals: ECG, ABP and CVP.
|
Overall results (%) |
CNN-LSTM |
ResNet18 |
ResNet34 |
ResNet50 |
|
Acc |
80.01 |
94.38 |
93.82 |
92.51 |
|
Pre |
84.50 |
94.29 |
94.54 |
92.37 |
|
Sen |
75.64 |
93.09 |
93.33 |
92.71 |
|
F1 score |
79.06 |
93.41 |
93.78 |
92.48 |
Table 4. The classification performance of the ResNet34 model on each individual class.
|
Paced Class |
Pre (%) |
Sen (%) |
F1 score (%) |
|
APVP_AVD120 |
94.75 |
93.42 |
94.08 |
|
APVP_AVD160 |
89.61 |
90.79 |
90.20 |
|
APVP_AVD200 |
91.49 |
92.47 |
91.98 |
|
APVP_AVD240 |
87.50 |
92.11 |
89.74 |
|
APVP_AVD280 |
95.45 |
91.30 |
93.33 |
|
APVP_AVD40 |
93.83 |
88.89 |
91.29 |
|
APVP_AVD80 |
86.21 |
92.59 |
89.29 |
|
APVS_AVD200 |
100 |
91.67 |
95.65 |
|
APVS_AVD220 |
100 |
100 |
100 |
|
APVS_AVD240 |
91.21 |
94.32 |
92.74 |
|
APVS_AVD280 |
96.55 |
94.92 |
95.73 |
|
APVS_AVD320 |
81.82 |
90.00 |
85.71 |
4.4. Paced Heartbeats Classification Across Varied Channels
The model that demonstrated superior performance when utilizing multi-channel data, specifically ResNet34, was subsequently employed to evaluate the classification performance of each isolated signal, the hemodynamic signals exclusively and combinations between the ECG lead and each of the blood pressure signals. This evaluation aimed to gauge the impact of ECG, ABP, and CVP signals on the classification of paced heartbeats by examining whether these signals contribute to information gain or loss.
Table 5 displays the results obtained from various signal combinations for analysis. When examining individual signals, ECG stands out as the top performer, achieving an Acc of 92.86% and a Pre of 92.27%. Conversely, among the haemodynamic signals, the ABP signal demonstrates the weakest classification performance with an Acc of 74.04%, Sen of 74.65%, and Pre of 73.96%. This outcome aligns with expectations since changes in pacing settings aren't effectively represented in the ABP signal's morphology. When evaluating CVP signals on their own, they yield an Acc of 74.38% and a Pre of 76.62%. However, the performance significantly improves to 91.62% Acc when combining ECG and ABP signals, and 93.41% when combining ECG and CVP signals. These findings suggest that combining ECG and CVP signals offers slightly better results for distinguishing between paced heartbeats compared to ECG and ABP signal combinations.
Table 5. The testing performance metrics of ResNet34 classifier on different one-channel and combination of channels as opposed to the multi-channel performance.
|
Signal |
Acc (%) |
Sen (%) |
Pre (%) |
|
ECG+ABP+CVP |
93.82 |
93.33 |
94.54 |
|
ECG |
92.86 |
91.92 |
92.27 |
|
ABP |
74.04 |
74.65 |
73.96 |
|
CVP |
74.38 |
74.83 |
76.62 |
|
ABP+CVP |
80.91 |
82.59 |
82.24 |
|
ECG+ABP |
91.62 |
91.10 |
91.95 |
|
ECG+CVP |
93.41 |
92.60 |
93.24 |
Table 6. The testing performance obtained by different research in relation to the proposed classifiers.
|
Study |
Year |
Method |
Signal |
Dataset |
Acc (%) |
Sen (%) |
Pre (%) |
|
[20] |
2018 |
1D-CNN-LSTM |
ECG- lead II |
MIT-BIH arrhythmia |
98.10 |
97.50 |
98.70 |
|
[14] |
2019 |
1D-CNN |
ECG- lead II |
MIT-BIH arrhythmia- |
98.30 |
95.51 |
- |
|
[27] |
2021 |
2D-ResNet101 |
ECG- lead II |
MIT-BIH arrhythmia |
99.75 |
91.36 |
99.85 |
|
[24] |
2022 |
1D-CNN |
ECG- lead II |
MIT-BIH arrhythmia |
99.33 |
98.52 |
99.60 |
|
[28] |
2022 |
2D-ResNet50 |
ECG- lead II |
MIT-BIH arrhythmia |
91.00 |
- |
- |
|
[29] |
2023 |
1D-ResNet |
ECG- lead II |
MIT-BIH arrhythmia |
98.63 |
92.41 |
99.06 |
|
|
2016 |
RF |
ECG+ABP +PPG |
Computing in Cardiology (CinC) Challenge 2015 |
90 |
- |
- |
|
[31] |
2016 |
SVM |
ECG+ABP +PPG |
Computing in Cardiology (CinC) Challenge 2015 |
- |
94.00 |
86.00 |
|
[33] |
2017 |
MLP |
ECG ECG +ABP |
MINIC physioNet |
89.00 96.60 |
- |
- |
|
[32] |
2017 |
LS-SVM |
ABP |
- |
95.75 |
96.77 |
- |
|
[35] |
2022 |
2D-CNN |
ABP |
Multi-Parameter databases (MIMIC) |
89.03 |
81.46 |
99.50 |
|
[7] |
2023 |
1D-ResNet50 |
ECG+ABP+CVP |
Our arrhythmia dataset |
99.58 |
99.58 |
99.60 |
|
[7] |
2023 |
1D-ResNet50 |
ECG |
Our arrhythmia dataset |
99.38 |
99.38 |
99.41 |
|
[7] |
2023 |
1D-ResNet50 |
ABP |
Our arrhythmia dataset |
98.79 |
98.70 |
98.78 |
|
[7] |
2023 |
1D-ResNet50 |
CVP |
Our arrhythmia dataset |
96.67 |
96.68 |
96.73 |
|
[7] |
2023 |
1D-ResNet50 |
ABP+CVP |
Our arrhythmia dataset |
98.19 |
98.19 |
98.29 |
|
Ours |
2023 |
1D-ResNet50 |
ECG+CVP |
Our arrhythmia dataset |
99.80 |
99.95 |
99.68 |
|
Ours |
2023 |
1D-ResNet50 |
ECG+ABP |
Our arrhythmia dataset |
99.80 |
99.68 |
99.95 |
|
[7] |
2023 |
1D-ResNet50 |
ECG-lead II |
MIT-BIH arrhythmia |
98.78 |
98.77 |
98.80 |
|
Ours |
2023 |
1D-ResNet34 |
ECG+ABP+CVP |
Our paced dataset |
93.82 |
93.33 |
94.54 |
|
Ours |
2023 |
1D-ResNet34 |
ECG |
Our paced dataset |
92.86 |
91.92 |
92.27 |
|
Ours |
2023 |
1D-ResNet34 |
ABP |
Our paced dataset |
74.04 |
74.65 |
73.96 |
|
Ours |
2023 |
1D-ResNet34 |
CVP |
Our paced dataset |
74.38 |
74.83 |
76.62 |
|
Ours |
2023 |
1D-ResNet34 |
ABP+CVP |
Our paced dataset |
80.91 |
82.59 |
82.24 |
|
Ours |
2023 |
1D-ResNet34 |
ECG+ABP |
Our paced dataset |
91.62 |
91.10 |
91.95 |
|
Ours |
2023 |
1D-ResNet34 |
ECG+CVP |
Our paced dataset |
93.41 |
92.60 |
93.24 |
4.5. Contextualizing Our Results
Table 6 illustrates the performance metrics obtained on the test set when using our models on different signals and combinations of signals in comparison with other methods used in the literature using the same channels. The first works that used multimodal signals for heartbeat classification were a result of the PhysioNet/Computing in Cardiology Challenge 2015 Reducing False Arrhythmia Alarms in the ICU. In [34], the authors extracted physiological and signal quality features and fed them to Random Forest (RF) models for the final classification. They achieved an average Acc of 90% on 5 classes, using paired RF classifiers. In [33], the authors performed arrhythmia classification using fused wavelet coefficients from ECG and ABP signals. Subsequently, the fused signals were used to extract frequency features that were given as input to a multi-layer perceptron neural network, achieving an Acc of 96.6%, 96.9%, 95.6% and 93.9% for 2, 3, 4 and 5 classes, respectively. Later, the same group proposed a Least Square SVM (LS-SVM) classifier that reached an accuracy of 95.75% and a Sen of 96.77% for 6 different arrhythmia classes using only ABP signals [32]. Compared to the previously mentioned studies, our approach demonstrated exceptional Acc, surpassing 99% for arrhythmia classification and achieving over 93% for paced class classification when we utilized ECG, ABP, and CVP channels collectively. When we evaluated each signal individually, we still achieved high accuracy, exceeding 90% for arrhythmia classification. Nonetheless, the accuracy dropped when distinguishing between various paced classes. This drop in Acc can primarily be attributed to the challenging task of distinguishing between different pacing settings, as these settings often produce similar signals. This similarity is particularly noticeable in the ABP and CVP signals, as they are not directly affected by changes in pacing settings.
Table 6 also presents our heartbeat classification results, which were obtained by training the ResNet50 model on the MIT-BIH arrhythmia database. This allows for a fair comparison with the methods listed in the table. As we can see, our results are comparable with the methods proposed in the literature when using the ResNet50 classifier, not only for our dataset, but also when applied to the MIT-BIH arrhythmia database. When using ECG lead II from MIT-BIH dataset to train the developed ResNet50 classifier, we achieved an Acc of 98.78%, Pre of 99.80% and Sen of 98.77%. This demonstrates that the proposed method is not only accurate, but it also achieves remarkable results across different datasets.
5. Conclusion
In this work, different deep learning methods including CNN-LSTM and different ResNet architectures were proposed for classification of 5 different arrhythmias and 12 different pacing scenarios using ECG, ABP and CVP signals collected in Harefield Hospital London. To be able to use these signals and correctly match the ECG heartbeat and the corresponding waves on the ABP and CVP signals, we employed a different segmentation approach which considers the delay between the ECG heartbeat and the response in the haemodynamic waveforms. These models, particularly the ResNet34 and ResNet50, can accurately extract features and classify the heartbeats taken from three channels without the need of any prior feature extraction techniques. Moreover, the presented results demonstrate the ability of individual haemodynamic signals of capturing changes that arise with the presence of arrhythmias, as well as changes that can distinguish among different pacing settings. This is important, as it highlights the ABP and CVP signals potential of being used in classification models for accurate heartbeat classification in the ICU, where these signals are already collected from patients for monitoring purposes. When comparing our results with the ones present in the literature (Table 6), we can conclude that this study achieves significant results not only when using our dataset, but also on the MIT-BIH arrhythmia database.
Acknowledgements
We would like to thank British Heart Foundation for sponsoring this project (No.FS/19/73/34690).
References
[1] Y. Kaya, "Detection of Bundle Branch Block using Higher Order Statistics and Temporal Features," IAJIT, vol. 18, no. 3, May 2021, doi: 10.34028/iajit/18/3/3. View Article
[2] B. J. Drew et al., "Practice Standards for Electrocardiographic Monitoring in Hospital Settings," Circulation, vol. 110, no. 17, pp. 2721-2746, Oct. 2004, doi: 10.1161/01.CIR.0000145144.56673.59. View Article
[3] W. M. Smith, F. Riddell, M. Madon, and M. J. Gleva, "Comparison of diagnostic value using a small, single channel, P-wave centric sternal ECG monitoring patch with a standard 3-lead Holter system over 24 hours," American Heart Journal, vol. 185, pp. 67-73, Mar. 2017, doi: 10.1016/j.ahj.2016.11.006. View Article
[4] A. Barbeito and J. B. Mark, "Arterial and Central Venous Pressure Monitoring," Anesthesiology Clinics of North America, vol. 24, no. 4, pp. 717-735, Dec. 2006, doi: 10.1016/j.atc.2006.08.008. View Article
[5] K. Lakhal et al., "Blood pressure monitoring during arrhythmia: agreement between automated brachial cuff and intra-arterial measurements," BJA: British Journal of Anaesthesia, vol. 115, no. 4, pp. 540-549, Oct. 2015, doi: 10.1093/bja/aev304. View Article
[6] D. J. Cook and D. L. Simel, "Does This Patient Have Abnormal Central Venous Pressure?," JAMA, vol. 275, no. 8, pp. 630-634, Feb. 1996, doi: 10.1001/jama.1996.03530320054034. View Article
[7] I. Cretu, A. Tindale, M. Abbod, A. Khir, W. Balachandran, and H. Meng, "Multimodal Arrhythmia Classification Using Deep Neural Networks," presented at the The 9th World Congress on Electrical Engineering and Computer Systems and Science, Aug. 2023. doi: 10.11159/icbes23.152. View Article
[8] A. L. Goldberger et al., "PhysioBank, PhysioToolkit, and PhysioNet: Components of a New Research Resource for Complex Physiologic Signals," Circulation, vol. 101, no. 23, Jun. 2000, doi: 10.1161/01.CIR.101.23.e215. View Article
[9] R. A. Alharbey, S. Alsubhi, K. Daqrouq, and A. Alkhateeb, "The continuous wavelet transform using for natural ECG signal arrhythmias detection by statistical parameters," Alexandria Engineering Journal, vol. 61, no. 12, pp. 9243-9248, Dec. 2022, doi: 10.1016/j.aej.2022.03.016. View Article
[10] G. S. Brindha and J. Manjula, "FPGA - Based ECG signal analysis for arrhythmia detection system using SVM classifier," AIP Conference Proceedings, vol. 2603, no. 1, p. 030005, Apr. 2023, doi: 10.1063/5.0126540. View Article
[11] I. Cretu, A. Tindale, M. Abbod, H. Meng, W. Balachandran, M. Mason, A.W. Khir, "Wavelet Transform and Nonlinear SVM for Cardiac Arrhythmia Classification," presented at the The 47th Annual Conference of the European Society for Artificial Organs (ESAO 2021), The International Journal of Artificial Organs. doi: https://doi.org/10.1177/03913988211038230. View Article
[12] U. R. Acharya et al., "A deep convolutional neural network model to classify heartbeats," Computers in Biology and Medicine, vol. 89, pp. 389-396, Oct. 2017, doi: 10.1016/j.compbiomed.2017.08.022. View Article
[13] E. Kıymaç and Y. Kaya, "A novel automated CNN arrhythmia classifier with memory-enhanced artificial hummingbird algorithm," Expert Systems with Applications, vol. 213, p. 119162, Mar. 2023, doi: 10.1016/j.eswa.2022.119162. View Article
[14] S. K. Pandey and R. R. Janghel, "Automatic detection of arrhythmia from imbalanced ECG database using CNN model with SMOTE," Australas Phys Eng Sci Med, vol. 42, no. 4, pp. 1129-1139, Dec. 2019, doi: 10.1007/s13246-019-00815-9. View Article
[15] M. Faizan, I. Intzes, I. Cretu, and H. Meng, "Implementation of Deep Learning Models on an SoC-FPGA Device for Real-Time Music Genre Classification," Technologies, vol. 11, no. 4, p. 91, Jul. 2023, doi: 10.3390/technologies11040091. View Article
[16] S. Singh, S. K. Pandey, U. Pawar, and R. R. Janghel, "Classification of ECG Arrhythmia using Recurrent Neural Networks," Procedia Computer Science, vol. 132, pp. 1290-1297, Jan. 2018, doi: 10.1016/j.procs.2018.05.045. View Article
[17] I. Cretu et al., "Classification of arrhythmias using an LSTM- and GAN-based approach to ECG signal augmentation," Europace, vol. 25, no. Supplement_1, p. euad122.622, May 2023, doi: 10.1093/europace/euad122.622. View Article
[18] P. Liu, X. Sun, Y. Han, Z. He, W. Zhang, and C. Wu, "Arrhythmia classification of LSTM autoencoder based on time series anomaly detection," Biomedical Signal Processing and Control, vol. 71, p. 103228, Jan. 2022, doi: 10.1016/j.bspc.2021.103228. View Article
[19] J. Zhang, A. Liu, M. Gao, X. Chen, X. Zhang, and X. Chen, "ECG-based multi-class arrhythmia detection using spatio-temporal attention-based convolutional recurrent neural network," Artificial Intelligence in Medicine, vol. 106, p. 101856, Jun. 2020, doi: 10.1016/j.artmed.2020.101856. View Article
[20] S. L. Oh, E. Y. K. Ng, R. S. Tan, and U. R. Acharya, "Automated diagnosis of arrhythmia using combination of CNN and LSTM techniques with variable length heart beats," Computers in Biology and Medicine, vol. 102, pp. 278-287, Nov. 2018, doi: 10.1016/j.compbiomed.2018.06.002. View Article
[21] C. Chen, Z. Hua, R. Zhang, G. Liu, and W. Wen, "Automated arrhythmia classification based on a combination network of CNN and LSTM," Biomedical Signal Processing and Control, vol. 57, p. 101819, Mar. 2020, doi: 10.1016/j.bspc.2019.101819. View Article
[22] E. Izci, M. A. Ozdemir, M. Degirmenci, and A. Akan, "Cardiac Arrhythmia Detection from 2D ECG Images by Using Deep Learning Technique," 2019 Medical Technologies Congress (TIPTEKNO), pp. 1-4, Oct. 2019, doi: 10.1109/TIPTEKNO.2019.8895011. View Article
[23] J. Huang, B. Chen, B. Yao, and W. He, "ECG Arrhythmia Classification Using STFT-Based Spectrogram and Convolutional Neural Network," IEEE Access, vol. 7, pp. 92871-92880, 2019, doi: 10.1109/ACCESS.2019.2928017. View Article
[24] E. H. Houssein, M. Hassaballah, I. E. Ibrahim, D. S. AbdElminaam, and Y. M. Wazery, "An automatic arrhythmia classification model based on improved Marine Predators Algorithm and Convolutions Neural Networks," Expert Systems with Applications, vol. 187, p. 115936, Jan. 2022, doi: 10.1016/j.eswa.2021.115936. View Article
[25] A. Y. Hannun et al., "Cardiologist-level arrhythmia detection and classification in ambulatory electrocardiograms using a deep neural network," Nat Med, vol. 25, no. 1, pp. 65-69, Jan. 2019, doi: 10.1038/s41591-018-0268-3. View Article
[26] K. He, X. Zhang, S. Ren, and J. Sun, "Deep Residual Learning for Image Recognition," in 2016 IEEE Conference on Computer Vision and Pattern Recognition (CVPR), Jun. 2016, pp. 770-778. doi: 10.1109/CVPR.2016.90. View Article
[27] Y. Zhang, J. Li, S. Wei, F. Zhou, and D. Li, "Heartbeats Classification Using Hybrid Time-Frequency Analysis and Transfer Learning Based on ResNet," IEEE J Biomed Health Inform, vol. 25, no. 11, pp. 4175-4184, Nov. 2021, doi: 10.1109/jbhi.2021.3085318. View Article
[28] A. Rahman et al., "ECG Classification for Detecting ECG Arrhythmia Empowered with Deep Learning Approaches," Comput Intell Neurosci, vol. 2022, p. 6852845, Jul. 2022, doi: 10.1155/2022/6852845. View Article
[29] F. Khan, X. Yu, Z. Yuan, and A. ur Rehman, "ECG classification using 1-D convolutional deep residual neural network," PLOS ONE, vol. 18, no. 4, p. e0284791, Apr. 2023, doi: 10.1371/journal.pone.0284791. View Article
[30] E. Jing, H. Zhang, Z. Li, Y. Liu, Z. Ji, and I. Ganchev, "ECG Heartbeat Classification Based on an Improved ResNet-18 Model," Computational and Mathematical Methods in Medicine, vol. 2021, p. e6649970, May 2021, doi: 10.1155/2021/6649970. View Article
[31] V. Kalidas and L. S. Tamil, "Cardiac arrhythmia classification using multi-modal signal analysis," Physiological Measurement, vol. 37, no. 8, p. 1253, Jul. 2016, doi: 10.1088/0967-3334/37/8/1253. View Article
[32] R. Arvanaghi, S. Daneshvar, H. Seyedarabi, and A. Goshvarpour, "Classification of cardiac arrhythmias using arterial blood pressure based on discrete wavelet transform," Biomed. Eng. Appl. Basis Commun., vol. 29, no. 05, p. 1750034, Oct. 2017, doi: 10.4015/S101623721750034X. View Article
[33] R. Arvanaghi, S. Daneshvar, H. Seyedarabi, and A. Goshvarpour, "Fusion of ECG and ABP signals based on wavelet transform for cardiac arrhythmias classification," Computer Methods and Programs in Biomedicine, vol. 151, pp. 71-78, 2017, doi: https://doi.org/10.1016/j.cmpb.2017.08.013. View Article
[34] L. M. Eerikainen, J. Vanschoren, M. J. Rooijakkers, R. Vullings, and R. M. Aarts, "Decreasing the false alarm rate of arrhythmias in intensive care using a machine learning approach," in 2015 Computing in Cardiology Conference (CinC), Nice, France: IEEE, Sep. 2015, pp. 293-296. doi: 10.1109/CIC.2015.7408644. View Article
[35] R. Arvanaghi, S. Danishvar, and M. Danishvar, "Classification cardiac beats using arterial blood pressure signal based on discrete wavelet transform and deep convolutional neural network," Biomedical Signal Processing and Control, vol. 71, p. 103131, 2022, doi: https://doi.org/10.1016/j.bspc.2021.103131. View Article