Journal of Biomedical Engineering and Biosciences (JBEB)
ISSN: 2564-4998

Volume 12 - Year 2025 - Pages 36-45
DOI: 10.11159/jbeb.2025.005
Impact of Nav1.8 Inhibitor on Acid‑Evoked Calcium Dynamics in NGF‑Sensitized Dorsal Root Ganglion Neurons
Elvin Zhang¹†,Angela Li2, Tianshuo He1, Ryan Liu¹†, Chengbiao Wu3, Linda Shi¹,*, Veronica Gomez-Godinez¹
1Institute of Engineering in Medicine, University of California, San Diego
9500 Gilman Drive, La Jolla, CA 92093
2College of Letters & Science, University of California, Berkeley
3Department of Neurosciences, University of California, San Diego, La Jolla, CA 92093
*Correspondence: zshi@ucsd.edu
†High school students participating in the IEM OPALS program
Abstract - Pain, especially chronic pain, that affects more than 50 million Americans represents a silent public health epidemic. Lack of effective pain treatment severely impacts patients’ quality of life and incurs extraordinary economic cost. Sodium channels that transmit key pain signals are promising targets for developing pain medicines. Herein, we investigated the cellular mechanism of a new sodium channel blocker targeting Nav1.8, HBW‑004285, in primary cultured mouse peripheral dorsal root ganglion neurons (DRGs). We studied the effectiveness of HBW‑004285 in blocking acid‑triggered pain signals. Mouse DRG neurons, primed with Nerve Growth Factor (NGF) to elicit sensitization, were briefly exposed to an acidic solution. Time‑lapse calcium imaging was used to monitor cellular pain activity. We showed that acid produced strong calcium surges, and NGF further sensitized the response. HBW‑004285 appeared to reduce the sustained phase more than the initial peak. Furthermore, a lower dose was as effective as or outperformed a higher dose, suggesting a robust potency of HBW‑004285 in blocking pain signals. Taken together, our study suggests that HBW-004285 is an effective pain blocker to support further validation and investigation of its potential therapeutical application.
Keywords: Calcium Signaling, Dorsal Root Ganglion, Nav1.8, Acid‑Sensing Ion Channels, Nerve Growth Factor, FWHM
© Copyright 2025 Authors This is an Open Access article published under the Creative Commons Attribution License terms. Unrestricted use, distribution, and reproduction in any medium are permitted, provided the original work is properly cited.
Date Received: 2025-01-24
Date Revised: 2025-09-11
Date Accepted: 2025-09-24
Date Published: 2025-10-30
1. Introduction
Chronic pain is a widespread and costly public health issue; In 2021, 51.6 million U.S. adults (20.9%) had chronic pain, and 17.1 million (6.9%) had high‑impact chronic pain that restricts daily activities [1]. Globally, ~619 million people suffer from debilitating low back pain [2]. Opioid-based medicine has been widely used for pain relief. However, these medications are addictive and often lead to drug overdose mortality [3]. These realities underscore the need for effective, non‑addictive analgesics for most subacute and chronic pain [4], as reflected in federal initiatives aimed at accelerating non‑addictive pain treatments [5].
Both peripheral and central processes contribute to pain signals. In the periphery, first‑order sensory neurons in the dorsal root ganglia (DRG) detect noxious mechanical, thermal, and chemical stimuli and encode them as action potentials [6]. Their central axons enter the spinal dorsal horn, where layered microcircuits of excitatory and inhibitory interneurons and projection neurons integrate, filter, and relay nociceptive input to supraspinal targets [7]. Fast GABAergic/glycinergic inhibition acts as a powerful gate control within these circuits; loss or weakening of this inhibition (disinhibition) promotes hyperexcitability and mechanical allodynia [8]. Central sensitization—a persistent increase in responsiveness of central nociceptive pathways, often maintained by glial‑mediated neuroinflammation—helps explain how pain can outlast or exceed the original peripheral insult [9].
Voltage‑gated sodium (Nav) channels are the core drivers of action‑potential initiation and propagation in nociceptors; by setting threshold, spike rate, and firing pattern, they determine how peripheral inputs are converted into ascending pain signals [10]. In DRG neurons, distinct Nav subtypes shape different phases of excitability; Sustained firing during persistent depolarization is a key feature of peripheral pain signaling [11]. Therapeutically, selective modulation of peripheral sodium channels has shown clinical promise: inhibition of a peripheral Nav subtype reduced acute postoperative pain in randomized trials, illustrating that peripheral channel block can lower pain [12, 13]. However, the clinical efficacy of sodium channel blockers has been inconsistent, underscoring the importance of further investigation of these blockers as a potential pain medicine [14].
Nav1.8 is a tetrodotoxin-resistant voltage-gated sodium channel highly expressed in DRG neurons, where it supports repetitive firing during sustained depolarization and contributes to the encoding of peripheral pain signals [15, 16]. The selective, peripherally acting Nav1.8 inhibitor, Suzetrigine (VX‑548), reduces acute postoperative pain versus placebo in randomized trials [17].
Intracellular Ca²⁺ is tightly coupled with the electrical activity of neurotransmitter release in neurons; as a result, the measurement of optical Ca²⁺ signals (dye‑based or GECI‑based) can serve as a surrogate indicator for nociceptor excitability and synaptic output both in vitro and in vivo [18 - 23].
The laser‑induced single‑cell (LIS) study helped establish our calcium‑imaging workflow and how we interpret the traces [24]. In that work, the team tracked how spontaneous Ca²⁺ activity changed across nearby cells. Two practical points shaped our approach. First, they registered every movie and carefully drew regions of interest to keep motion from distorting ΔF/F₀. Second, they showed that how long the signal lasts and how much calcium accumulates (FWHM and AUC) can be more informative than peak height alone. Following the same logic, we report FWHM and AUC alongside peak and use field‑geometry overlays to document where cells were sampled.
The objective of this study was to test the efficacy of HBW‑004285, a novel Nav1.8 inhibitor, in curbing acid‑evoked excitability in DRG neurons. Time‑lapse Ca²⁺ imaging was studied to quantify the effect [18, 21, 23]. The results have demonstrated that HBW‑004285 effectively attenuated pain signals. Unlike previous blockers, HBW-004285 exhibited stronger potency at lower doses, a characteristic that was unusual and clinically significant.
2. Materials and Methods
2.1. Experimental Procedure
Primary mouse DRG neuron cultures were prepared using standard enzymatic dissociation and plated onto glass‑bottom dishes [25].
Cells were labeled with Fluo‑4 AM calcium dye (2 µM) in Hanks’ balanced saline supplemented with probenecid (2.5 mM) for 35 min at room temperature, washed, and returned to recording solution, following recent live‑cell Ca²⁺ imaging practices [26]. Inspired by Sophia et al. (2023), which used laser‑induced micro‑injury and time‑lapse fluorescence to show how oxidative stress (H₂O₂) and NAD/SARM1 pathway modulation reshaped neuronal dynamics [26], this study adopted a rigorous live‑cell Ca²⁺‑imaging workflow with waveform‑based metrics (ΔF/F₀, FWHM, AUC) to quantify how Nav1.8 inhibition altered sustained, acid‑evoked excitability in DRG neurons.
Throughout imaging, dishes were maintained on a stage heater at 37 °C (5% CO₂ if applicable). DMSO was held constant at 0.1% (v/v) across all conditions. Cells were exposed to a pH of 5.7 to evoke Ca²⁺ responses. Parallel groups received vehicle or HBW‑004285 (from Hyperway Pharmaceutical Co., Ltd.) at 10 µM or 100 µM. Optional mechanistic controls included Ca²⁺‑free medium with EGTA (1 mM) and/or BAPTA‑AM (1 µM) to probe the contribution of extracellular entry versus internal stores. Time‑lapse epifluorescence microscopy (Zeiss) was performed at 3‑s intervals for 15 min. Videos were registered to correct drift, and regions of interest were tracked using a customized ImageJ script.
As illustrated in Table 1, four dishes (D1–D4) were used, each with a paired baseline condition (DMSO, nominal pH 7.4) and an acid‑challenge condition (pH 5.7). D1 served as the control sample to establish baseline Ca²⁺ activity. D2 was the acid‑only control (DMSO + pH 5.7) used to quantify the effect of acidosis. D3 tested the Nav1.8 inhibitor HBW‑004285 under acid challenge at 100 µM, and D4 tested the inhibitor at 10 µM. DMSO concentration, imaging settings, and acquisition timing were held constant across dishes.
Table 1. Dish‑level treatment conditions for acid-evoked Ca²⁺ imaging in mouse DRG neurons
|
Dish 1 |
Dish 2 |
Dish 3 |
Dish 4 |
|
D1 |
D2 DMSO |
D3 DMSO |
D4 DMSO |
|
D1 DMSO |
D2 DMSO + pH5.7 |
D3 DMSO + pH5.7+ 100µM Drug (HBW-004285) |
D4 DMSO + pH5.7 + 10µM Drug (HBW-004285) |
2.2. Image Analysis
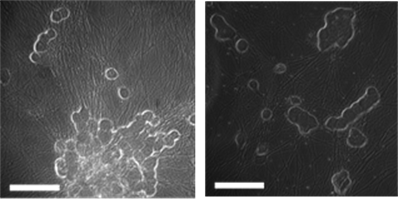
Figure 1 shows paired phase‑contrast (top row) and calcium dye fluorescence images (bottom row) from the same fields of view in cultured mouse DRG neurons. Panel (a) depicts cells in 0.1% DMSO; panel (b) shows cells exposed to a Nav1.8 inhibitor during an acid challenge (pH 5.7), as labeled. The phase images documented comparable cell‑body morphology and attachment, while the matched fluorescence frames visualized the spatial distribution of Ca²⁺‑responsive cells (bright puncta) at the time of response. These micrographs were intended as qualitative context—to illustrate the fields used for ROI selection and registration—and complement the quantitative time‑series analysis of ΔF/F₀, FWHM, and AUC reported elsewhere, rather than serving as a direct intensity comparison between conditions.
(a) (b)
(c) (d)
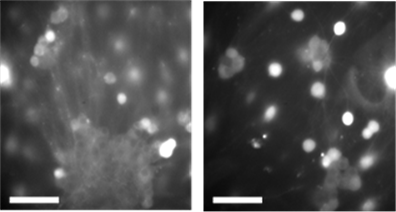
The geometry and cell selection used for quantitative Ca²⁺ analysis was carefully recorded. During ROI selection, any cells with ambiguous borders or overlap in the imaging plane were excluded to minimize ROI cross‑contamination. In Figure 2, the blue circles mark the analyzable cell bodies, and the white vectors register each cell’s radial distance from the stimulation center, ensuring that distance‑to‑stimulus is tracked consistently when extracting ΔF/F₀ traces. Across panels, the number and spread of ROIs were broadly comparable within each dish pair (baseline vs treatment), indicating that subsequent differences in waveform metrics (e.g., FWHM and AUC) were unlikely to arise from systematic changes in field‑of‑view geometry or proximity to the stimulus. These annotations were generated during preprocessing (drift registration, ROI placement, background ROI, and distance export) and served as methodological context for the quantitative results reported in the main figures. These overlays were generated with MATLAB and ImageJ/FIJI workflow, which includes selecting the pre‑stimulus frame, adding a background ROI, saving per‑cell distances for each field of view, and quantitatively extracting ΔF/F₀ traces and waveform features (peak, FWHM, AUC). The raw frames here served as qualitative context for those measurements and documented ROI placement and distance mapping used in the subsequent analyses.
(a)
(b)
(c)
(d)
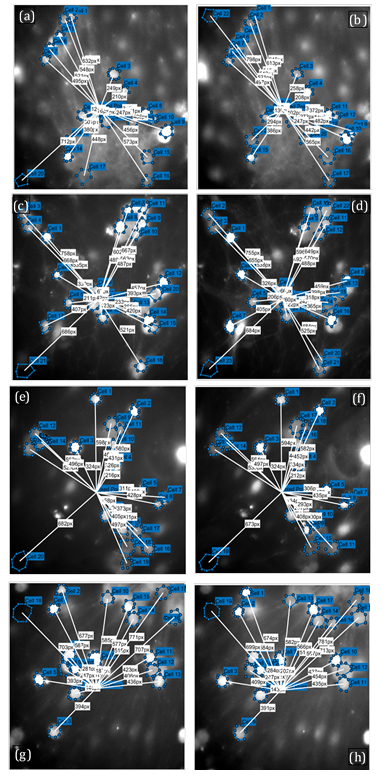
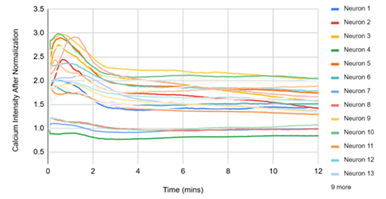
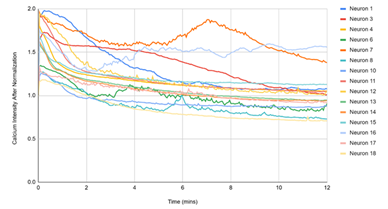
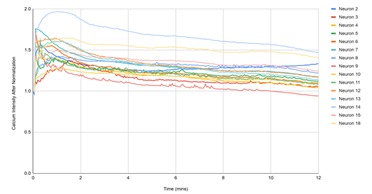
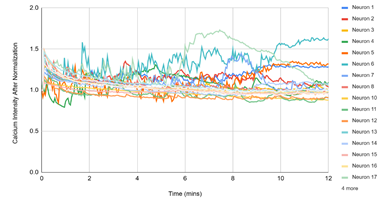
Figure 3 displayed single‑cell Ca²⁺ traces (each line = one neuron) over 12 min for the matched experimental conditions. (1) D1, DMSO: traces remain near baseline, reflecting spontaneous activity under vehicle. (2) D2, DMSO + pH 5.7: a rapid, synchronous rise followed by a slow decay indicates a robust acid‑evoked response. (3) D3, pH 5.7 + HBW‑004285 (as labeled): the initial rise was present in many cells, but the signals decayed more quickly and settled closer to baseline than D2, indicating attenuation of the response. (4) D4, pH 5.7 + HBW‑004285: responses were further shortened and plateau at lower levels, consistent with a stronger qualitative reduction in time‑integrated signal compared with D2. Overall, the time‑course patterns supported the quantitative finding that Nav1.8 inhibition reduced the duration and integrated load of acid‑evoked Ca²⁺ signals more than the initial peak.
Fluorescence intensity quantifications were made using FIJI ImageJ. The background of each image was subtracted before quantifying the fluorescence of the cell body. All traces were normalized to the mean baseline before stimulation. MATLAB was utilized to find the peak properties of each Ca2+ transient. GraphPad Prism was used to find statistical significance. Signals were normalized to baseline (ΔF/F₀; baseline window 60 s). For each trace, peak amplitude, full width at half maximum (FWHM), and area under the curve (AUC) were quantified. To avoid replication, dish‑level means (cells nested within dishes) were computed. Data were reported as mean ± SEM with 95% confidence intervals and the exact p‑values.
2.3. Experiment with NGF
This experiment aimed to evaluate the efficacy of the Nav1.8 inhibitor HBW‑004285 in modulating channel functionality. The study utilized PC-12, a pheochromocytoma cell line exhibiting properties similar to DRG neurons. Nerve Growth Factor (NGF), involved in pain sensitization, will induce a calcium influx in PC-12 cells, mimicking a nociceptive-like response. For readability, the subsequent analysis and discussion refered to these preparations as mouse DRG neurons. This study hypothesized that an effective Nav1.8 inhibitor would suppress NGF-induced responses in DRG neurons.
The experimental design included four separate samples of mouse DRG neurons. As illustrated in Table 2, Dish 1 compared cell behavior before and after the addition of DMSO. Dish 2, 3, and 4 pre-stimuli included cells and DMSO, and post-stimuli included NGF in all dishes. Dish 2 served as the control, with no drug dosage; Dish 3 included 100 µM of the inhibitor (HBW-004285) post-stimuli; and Dish 4 included 10 µM. Before imaging, cells were loaded with Fluo-4 AM, a fluorescent calcium indicator, to visualize calcium signaling. Images were then captured for 15 minutes, before and after the stimuli, using a Zeiss 40x objective microscope at 3-second intervals per sample. The average brightness of the cells, reflecting calcium intensity, was measured using ImageJ at pre-stimulation, immediately post-stimulation, and 5, 10, and 15 minutes post-stimulation. The values were then normalized and compiled into graphs.
Table 2. Dish‑level pretreatments for NGF‑sensitized mouse DRG neurons
|
Dish 1 |
Dish 2 |
Dish 3 |
Dish 4 |
|
DMSO |
DMSO + NGF |
DMSO + NGF + 100µM Drug (HBW-004285) |
DMSO + NGF + 10µM Drug (HBW-004285) |
3. Results and Discussion
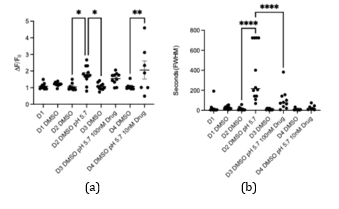
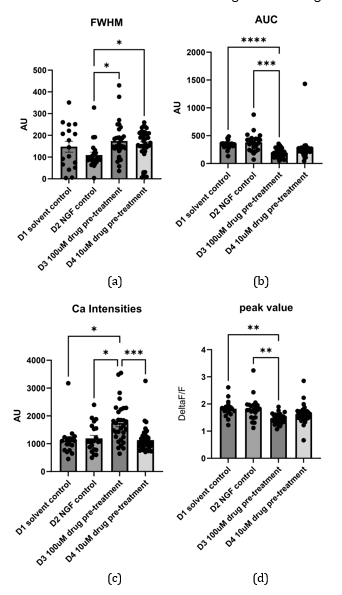
In Figure 4, two waveform features—normalized Ca²⁺ intensity and FWHM—across the four experimental conditions (solvent control, NGF control, 100 µM HBW‑004285 + NGF, and 10 µM HBW‑004285 + NGF) were summarized. Relative to solvent, NGF increased both overall fluorescence intensity and event width, consistent with sensitization of DRG neurons. HBW‑004285 pretreatment reduced the NGF‑elevated signals, with the effect most evident in FWHM, indicating briefer Ca²⁺ transients. In contrast, the intensity reductions were present but less uniform across dishes, as reflected by the bracketed significance markers in the plots. Taken together, the Figure 4 data indicated that Nav1.8 inhibition primarily shortened the duration of acid‑evoked Ca²⁺ responses while exerting a more modest and variable effect on the normalized intensity.
After adding 100 µM of the drug, the peak value of the calcium signaling decreased, compared to the control groups that didn’t have the drug. This meant that the HBW drug was able to reduce calcium excitability, which regulated pain. The FWHM showed the duration of the highest peak of calcium levels. The duration of the calcium spike was different in the control group with NGF, versus the group with NGF + medicine pretreatment. Thus, HBW‑004285 modulated and maintained the calcium levels, even with increased NGF. Comparing D3 and D2, calcium displacement was a lot smaller in HBW‑004285-treated neurons. Relative to NGF alone, both doses reduced time‑integrated activity, with the clearest effects in FWHM and AUC; peak ΔF/F₀ showed smaller and sometimes non‑significant changes.
Across conditions, acidification to pH 5.7 produced a rapid ΔF/F₀ rise that decayed over minutes, and NGF pretreatment increased both the peak and integrated responses relative to the solvent. HBW‑004285 reduced the overall Ca²⁺ burden primarily by shortening event duration: FWHM and AUC were consistently lower than NGF alone, whereas peak ΔF/F₀ showed smaller and less uniform reductions. In multiple datasets, 10 µM produced a greater decrement than 100 µM, suggesting a non‑monotonic concentration dependence that merits replicated, dish‑level testing. The apparent 10 µM > 100 µM effect was consistent with a non‑linear dose–response, possibly due to receptor desensitization and use‑dependent Nav1.8 block. This was flagged as a candidate for future dish‑replicated concentration–response investigation.
During time‑lapse acquisition, occasional lateral displacement and minor focus drift of individual cells were observed, arising from cell motility and routine handling. To mitigate these artifacts, frames were registered before ROI extraction so that each cell’s position was maintained across the sequence. While this alignment procedure substantially reduced motion‑related bias, interpolation and background re‑estimation can introduce small shifts in fluorescence readouts; thus, a minor residual impact on calcium‑intensity measurements cannot be completely ruled out.
A practical but important source of uncertainty in the Ca²⁺ measurements was manual ROI definition when neuronal cell bodies were closely apposed or partially overlapping in the imaging plane. In such fields, a circular ROI drawn on the pre‑stimulus frame can inadvertently include pixels from a neighboring cell or, conversely, exclude part of the target cell; because ΔF/F₀ averages all enclosed pixels, even small boundary errors can inflate peak values if a bright neighbor “bleeds” into the ROI and can bias time‑integrated metrics (FWHM, AUC) by double‑counting fluorescence or diluting the true signal. This risk was greatest in clustered areas like those documented in the ROI‑mapping panels, where many analyzable cell bodies lied within a few microns of each other. To mitigate this, ROIs were delineated on the frame immediately before stimulation, the phase image was used to guide boundaries, applied per‑ROI local background subtraction, excluded ambiguous or visibly overlapping profiles, and registered movies before ROI tracking to prevent drift‑induced overlap, consistent with the step‑by‑step ImageJ/MATLAB workflow used in this study. In the next phase of this research, it was recommended to conduct sensitivity checks that (i) re‑compute metrics after removing ROIs whose nearest‑neighbor distance fallen below a preset threshold, and (ii) repeat analysis with semi‑automated segmentation (e.g., watershed‑based) to confirm that the principal findings—shorter FWHM and lower AUC with HBW‑004285—did not depend on any single set of manual ROI decisions.
4. Conclusion
The experimental resulted demonstrate that acidic conditions (pH 5.7) reliably increased intracellular Ca²⁺ signals in mouse DRG neurons, and NGF sensitization amplified these responses. Pretreatment with the Nav1.8 inhibitor HBW‑004285 chiefly shortened the responses and reduced total Ca²⁺ load (decreases in FWHM and AUC), while effected on peak ΔF/F₀ were smaller and variable. Dose–response patterns were nonlinear; possible explanations included receptor desensitization and use‑ or state‑dependent Nav1.8 block to evaluate in a future concentration–response study. Taken together, the findings indicated that the Nav1.8 inhibitor HBW‑004285 limited the sustained phase of acidosis-induced excitability rather than blocking the initial proton‑driven peak. Thus, inhibiting Nav1.8 with HBW-004285 potentially represented a novel pain treatment strategy that differed from opioid-based pain medication.
This study has several limitations. Dish‑level replication was modest, limiting power for between‑condition contrasts and for resolving the non‑linear dose pattern. Manual ROI delineation in crowded fields can mix neighboring signals or truncate boundaries, biasing ΔF/F₀, FWHM, and AUC. Despite drift registration, residual motion/focus changes, heterogeneous dye loading, and illumination shading may introduce small errors, and integrated metrics were sensitive to baseline‑window and registration choices.
5. Future Work
This manuscript presented preliminary data and included extensive exploration analyses. The dataset was interpreted to indicate that HBW-004285 preferentially shortened the sustained Ca²⁺ component while exerting smaller effects on the initial peak. In several instances, the 10 µM dose matched or exceeded the effect of 100 µM. Future work will test and extend these findings. A full concentration–response curve will be mapped, using replicated dishes and time-of-addition controls, to determine whether the apparent nonlinearity (10 µM sometimes ≥ 100 µM) persists. To address current limitations—modest dish replication, manual ROI drawing, and motion/drift—semi-automated segmentation will be implemented, analysis windows will be preregistered, acquisition control will be tightened, and effect sizes will be reported with confidence intervals. These steps were designed to build directly on the present findings and to test whether the observed reduction in sustained activity translates into pain-relevant outcomes.
Acknowledgements
This work was supported by a generous gift from Beckman Laser Institute Inc. to LS and VGG. The high school students (†) participated in the UCSD IEM OPALS internship. Special thanks to Dr. Shu Chien from UCSD Bioengineering, Dr. Lizhu Chen from CorDx Inc., Dr. Xinhua Zheng, David & Leslie Lee, Mingwei Hu and Wen Shi for their generous donations.
References
[1] S. M. Rikard, A. E. Strahan, K. M. Schmit, and G. P. Guy Jr., "Chronic Pain Among Adults - United States, 2019-2021," Morbidity and Mortality Weekly Report, vol. 72, no. 15, pp. 379-385, 2023. Available: View Article
[2] GBD 2021 Low Back Pain Collaborators, "Global, regional, and national burden of low back pain, 1990-2020, its attributable risk factors, and projections to 2050: a systematic analysis of the Global Burden of Disease Study 2021," The Lancet Rheumatology, vol. 5, no. 6, pp. e316-e329, 2023.
[3] National Center for Health Statistics (CDC), "U.S. Overdose Deaths Decrease Almost 27% in 2024," CDC Press Release, May 14, 2025.
[4] D. Dowell, K. R. Ragan, C. M. Jones, G. T. Baldwin, and R. Chou, "CDC Clinical Practice Guideline for Prescribing Opioids for Pain - United States, 2022," MMWR Recommendations and Reports, vol. 71, no. 3, pp. 1-95, 2022. Available: View Article
[5] National Institutes of Health, "NIH HEAL Initiative: The Helping to End Addiction Long term® Initiative," 2023-2025.
[6] D. Usoskin, A. Furlan, S. Islam, H. Abdo, P. Lönnerberg, D. Lou, J. Hjerling Leffler, J. Haeggström, O. Kharchenko, P. V. Kharchenko, S. Linnarsson, and P. Ernfors, "Unbiased classification of sensory neuron types by large scale single cell RNA sequencing," Nature Neuroscience, vol. 18, no. 1, pp. 145-153, 2015. Available: View Article
[7] C. Peirs and R. P. Seal, "Neural circuits for pain: Recent advances and current views," Science, vol. 354, no. 6312, pp. 578-584, 2016. Available: View Article
[8] H. U. Zeilhofer, H. Wildner, and G. E. Yévenes, "Fast synaptic inhibition in spinal sensory processing and pain control," Physiological Reviews, vol. 92, no. 1, pp. 193-235, 2012. Available: View Article
[9] R. R. Ji, A. Nackley, Y. Huh, N. Terrando, and W. Maixner, "Neuroinflammation and central sensitization in chronic and widespread pain," Anesthesiology, vol. 129, no. 2, pp. 343-366, 2018. Available: View Article
[10] J. N. Wood, N. Yan, J. Huang, J. Zhao, A. Akopian, J. J. Cox, C. G. Woods, and M. A. Nassar, "Sensory neuron sodium channels as pain targets; from cocaine to Journavx (VX 548, suzetrigine)," Journal of General Physiology, vol. 157, no. 4, e202513778, 2025. Available: View Article
[11] J. W. Heinle, S. Dalessio, P. Janicki, A. Ouyang, K. E. Vrana, V. Ruiz Velasco, and M. D. Coates, "Insights into the voltage gated sodium channel, NaV1.8, and its role in visceral pain perception," Frontiers in Pharmacology, vol. 15, 1398409, 2024. Available: View Article
[12] J. Jones et al., "Selective inhibition of NaV1.8 with VX 548 for acute pain," New England Journal of Medicine, vol. 389, no. 5, pp. 393-405, 2023. Available: View Article
[13] S. G. Waxman, "Targeting a peripheral sodium channel to treat pain," New England Journal of Medicine, vol. 389, no. 5, pp. 466-469, 2023. Available: View Article
[14] J. Yang, Y. F. Xie, R. Smith, S. Ratté, and S. A. Prescott, "Discordance between preclinical and clinical testing of NaV1.7 selective inhibitors for pain," PAIN, vol. 166, no. 3, pp. 481-501, 2025. Available: View Article
[15] J. W. Heinle, S. Dalessio, P. Janicki, A. Ouyang, K. E. Vrana, V. Ruiz Velasco, and M. D. Coates, "Insights into the voltage gated sodium channel, NaV1.8, and its role in visceral pain perception," Frontiers in Pharmacology, vol. 15, 2024, article 1398409. Available: View Article
[16] J. N. Wood, N. Yan, J. Huang, J. Zhao, A. Akopian, J. J. Cox, C. G. Woods, and M. A. Nassar, "Sensory neuron sodium channels as pain targets; from cocaine to Journavx (VX 548, suzetrigine)," Journal of General Physiology, vol. 157, no. 4, e202513778, 2025. Available: View Article
[17] J. Jones et al., "Selective inhibition of NaV1.8 with VX 548 for acute pain," New England Journal of Medicine, vol. 389, no. 5, pp. 393-405, 2023. Available: View Article
[18] F. Iseppon, J. E. Linley, and J. N. Wood, "Calcium imaging for analgesic drug discovery," Neurobiology of Pain, vol. 11, 2022, 100083. Available: View Article
[19] Q. Xu and X. Dong, "Calcium imaging approaches in investigation of pain mechanism in the spinal cord," Experimental Neurology, vol. 317, pp. 129-132, 2019. Available: View Article
[20] C. Chen, J. Zhang, L. Sun, Y. Zhang, W. B. Gan, P. Tang, and G. Yang, "Long term imaging of dorsal root ganglia in awake behaving mice," Nature Communications, vol. 10, 2019, 3087. Available: View Article
[21] X. Gao et al., "Calcium imaging in population of dorsal root ganglion neurons unravels novel mechanisms of visceral pain sensitization and referred somatic hypersensitivity," PAIN, vol. 162, no. 4, pp. 1068-1081, 2021. Available: View Article
[22] H. Ishida et al., "In Vivo Calcium Imaging Visualizes Incision Induced Primary Afferent Sensitization and Its Amelioration by Capsaicin Pretreatment," Journal of Neuroscience, vol. 41, no. 41, pp. 8494-8507, 2021. Available: View Article
[23] C. Warwick et al., "Cell type specific calcium imaging of central sensitization in mouse dorsal horn," Nature Communications, vol. 13, 2022, 5199. Available: View Article
[24] V. Gomez Godinez et al., "A single cell death is disruptive to spontaneous Ca²⁺ activity in astrocytes," Frontiers in Cellular Neuroscience, vol. 16, 2022, 945737. Available: View Article
[25] Y. Gu et al., "Mitochondria dysfunction in Charcot Marie Tooth 2B Peripheral Sensory Neuropathy," Communications Biology, vol. 5, no. 1, 717, 2022. Available: View Article
[26] B. Sophia et al., "Impacts of H2O2, SARM1 inhibition, and high NAm concentrations on Huntington's disease laser-induced degeneration," Journal of Biophotonics, December, 2023.